Research


Our group has been working in the following research directions:

1.Acceleration of spectroscopic imaging and single-point spectroscopy

2.Development of snapshot depth sensitive and depth resolved optical spectroscopy

3.Surface enhanced Raman spectroscopy for malaria diagnosis and intradermal measurements


1. Acceleration of spectroscopic imaging and single-point spectroscopy

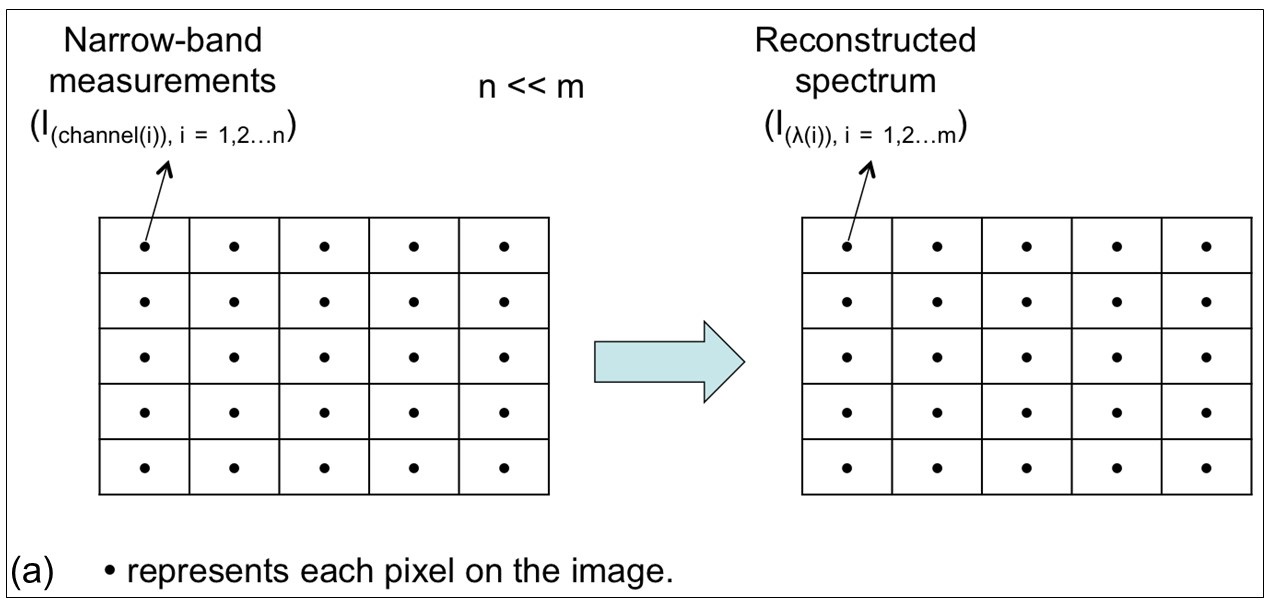
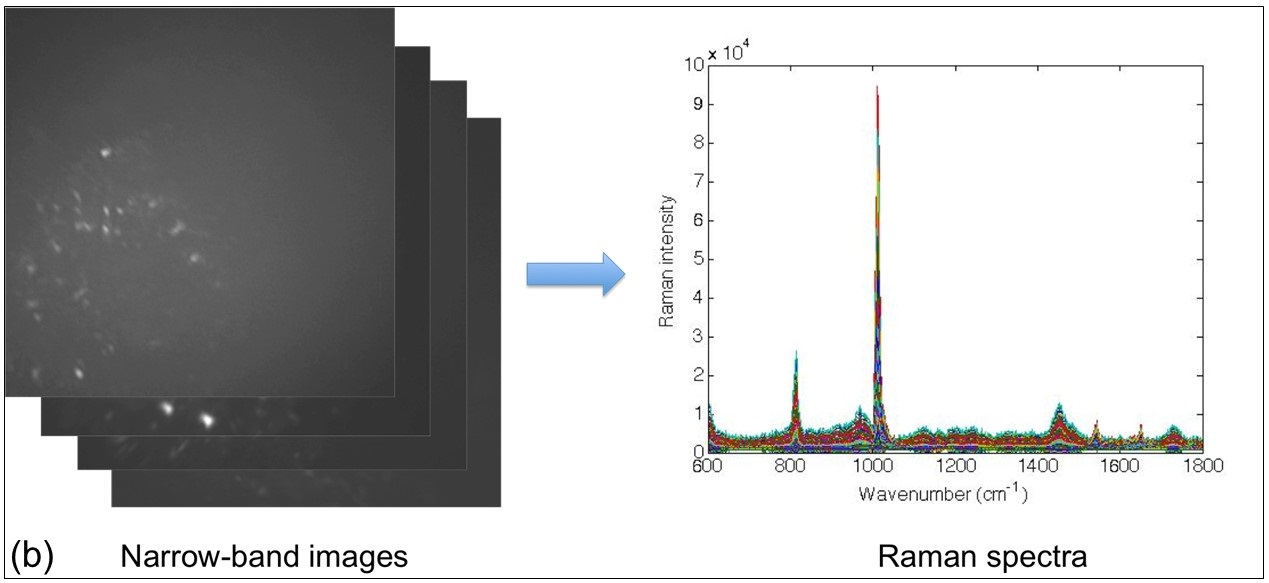
The speed of data acquisition especially in a spectroscopic imaging setup is a major hurdle that prevents optical spectroscopy and imaging techniques from being widely adopted in the clinical setting. To address this problem, our group proposed a new approach in 2012 to achieve fast spectroscopic imaging while keeping high spectral resolution, in which narrow-band or wide-band imaging quickly captures all required data and full spectra at all pixels are reconstructed efficiently. While the former step increases the signal to noise ratio significantly by integrating over a range of wavelengths thus enabling fast image acquisition, the latter step recovers the Raman spectra with high spectral resolution at all pixels. Our group developed a method of modified Wiener estimation (Journal of Biomedical Optics 2012, US Provisional Patent Application No. 61/682,903) to enable the reconstruction of diffuse reflectance spectra from color images with high accuracy. This method was further developed for the reconstruction of Raman spectra from narrow-band measurements (Journal of Raman Spectroscopy 2013). This work could speed up data acquisition by three orders of magnitude, which opens the possibility of rapid Raman imaging for the monitoring of dynamically changing events in biological samples. This method makes it possible to diagnose cornea infection non-invasively using Raman spectroscopy (Optics Express 2014, US Provisional Patent Application No. 61/926,518), which was not feasible previously due to the intolerably long Raman data acquisition required. To overcome the limitation of Wiener estimation in the requirement of a calibration data set, in which the calibration samples have to be similar to test samples in Raman features, we have proposed a method (IEEE JSTQE 2015) to create a universal calibration data set based on the measurements of multiple basic biochemical components for Raman reconstruction in cell samples. The proposed method has been demonstrated effective in both liquid phantoms and cell measurements. A fast wide-field Raman spectroscopic imaging system based on simultaneous multi-channel image acquisition has been developed to demonstrate the effectiveness of this approach (Optics Letters 2016). The same principle can be applied to spectral diffuse reflectance and fluorescence imaging too.
 
Fast Raman Spectroscopic Imaging
 
Fig. 1 (a) Principle of spectrum reconstruction and (b) narrow-band Raman images and reconstructed Raman spectra.


In optical spectroscopy, an array detector, e.g., charge coupled device (CCD) and complementary metal-oxide-semiconductor (CMOS), in combination with a dispersive device such as a grating or prism is the most widely used configuration, where the input light at each wavelength is dispersed and focused onto a different spatial location thus suffering from low signal-to-noise ratio (SNR). In contrast, wavelength multiplexing techniques such as Hadamard transform spectroscopy and compressive sensing can achieve high SNR by combining the spatial modulation of dispersed light and a single-pixel detector. Such single pixel spectroscopy holds potential for recording dynamic events because of the fast speed of single-pixel detectors. Furthermore, single pixel spectroscopy offers an alternative to spectroscopic applications in the infrared (IR) region, where silicon-based array detectors are inefficient and expensive.
 
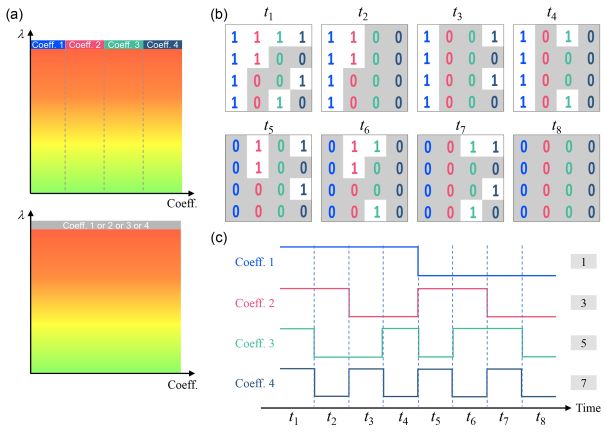
The common disadvantage of all the past single pixel spectroscopy techniques is that coding is conducted for one Hadamard coefficient (or one coding mask in compressive sensing) at a time along the wavelength dimension and multiple Hadamard coefficients have to be measured sequentially using direct current (DC) measurements, which is subject to the influence of noise and signal drift thus prolonging measurements. We recently proposed a new technique (IEEE Photonics Journal 2020, Optics Express 2022), i.e. sequency encoding single pixel spectroscopy (SESPS), to improve the SNR and resistance to signal drift, in which each Hadamard coefficient is encoded with a sequency value along one column of 2D masks on a digital micromirror device (DMD) thus enabling the concurrent coding of all Hadamard coefficients as demonstrated in Fig. 2. As a result, all Hadamard coefficients can be reconstructed simultaneously each with a pre-allocated sequency from the alternating current (AC) measurements of the time-domain signal. Note that sequency can be viewed as a general term for frequency and refers to the average number of zero-crossings per unit time interval. This scheme is analogous to the frequency-division multiplexing scheme in telecommunications in that desired information is encoded in a range of frequencies and can be extracted from AC measurements. Compared to the DC measurements, the AC measurements of Hadamard coefficients can speed up data acquisition because of lower 1/f noise at higher frequencies associated with detectors in general. As a proof-of-principle demonstration, the spectral measurements of white light sources and fluorescence particles by the SESPS with 32 spectral channels are about 14 times and 70 times faster than those using a commercial spectrometer, respectively, when the relative root mean square error (RMSE) is around 3% or smaller. The data acquisition speed can be increased by an extra 4 times when only eight spectral channels are used to achieve a compression ratio (CR) of 4:1 with a slight increase in relative RMSE.
Fast Raman Spectroscopic Imaging
Fig. 2. Illustration of 2D masks in sequency encoding single-pixel spectroscopy (SESPS) in case of N=4.(a) The upper graph denotes the proposed 2D encoding (i.e., along the wavelength and Hadamard coefficient dimensions) scheme in SESPS, the lower graph denotes the 1D encoding (i.e., along the wavelength dimension) scheme in the traditional SPS-HT. (b) 2D masks for sequency encoding that follow the layout of axes in (a) and corresponding matrices at eight different time points (ti, i = 1, 2,...., 8). (c) Illustration of sequency encoding along the time dimension in one period of time, in which the sequency value corresponding to each coefficient is listed to the right.
 
The SESPS can achieve a maximum speed of a few kilohertz in spectral measurements with high SNR subject to the refreshing rate of the DMD. We recently propose another technique based on acousto-optic deflector (AOD) that can further boost the speed of continuous-wave spectral measurements to the order of megahertz, which has reached beyond any commercial optical spectrometer. These fast spectrometry techniques could be adopted to measure various time-sensitive events or moving samples including in vivo tissue measurements and chemical reaction kinetics, for process monitoring during manufacturing and cell measurements in flow cytometry.
 
Relevant Publications:
14. Yi Zhang, Mohammad O. A. Malik, Jian Kang, Clement Yuen, and Quan Liu*, "Sequency encoding single pixel spectroscopy based on Hadamard transform," Optics Express,30(17) 30121-30134 (2022).
13. Yi Zhang, Jian Kang, Chao-Mao Hsieh, and Quan Liu*, "Compressive Optical Spectrometry Based on Sequency-Ordered Hadamard Transform," IEEE Photonics Journal, 12(5), 390008, (2020).
12. Yanru Bai, and Quan Liu*, "Denoising Raman spectra by Wiener estimation with a numerical calibration dataset," Biomedical Optics Express, 11(1), 200-214 (2020).
11. Jian Kang, Xiang Li, and Quan Liu*, "Hadamard transform-based calibration method for programmable optical filters based on digital micro-mirror device," Optics Express 26, 19563-19573 (2018).
10. Shuo Chen, Lingmin Kong, Wenbin Xu, Xiaoyu Cui*, and Quan Liu*, "A fast fluorescence background suppression method for Raman spectroscopy based on stepwise spectral reconstruction," IEEE Access, 6, 67709 - 67717 (2018).
9. Shuo Chen, Gang Wang, Xiaoyu Cui and Quan Liu*, "A stepwise method based on Wiener estimation for spectral reconstruction in spectroscopic Raman imaging," Optics Express 25(2), 1005-1018 (2017).
8. Shuo Chen, Caigang Zhu, Christopher Hoe-Kong Chui, Gyanendra Sheoran, Bien-Keem Tan, and Quan Liu*, "Spectral diffuse reflectance and autofluorescence imaging can perform early prediction of blood vessel occlusion in skin flaps," Journal of Biophotonics, In Press (2016).
7. Dong Wei, Shuo Chen, Yi Hong Ong and Quan Liu*, "Fast wide-field Raman spectroscopic imaging based on simultaneous multi-channel image acquisition and Wiener estimation," Optics Letters, 41(12), 2783-2786 (2016).
6. Shuo Chen, Yi Hong Ong, and Quan Liu*, "A method to create a universal calibration data set for Raman reconstruction based on Wiener estimation," IEEE Journal of Selected Topics in Quantum Electronics, 22(3), 6800407. (2016).
5. Shuo Chen, Yi Hong Ong, Xiaoqian Lin and Quan Liu*, "Optimization of Advanced Wiener Estimation Methods for Raman Reconstruction from Narrow-band Measurements in the Presence of Fluorescence Background," Biomedical Optics Express, 6(7), 2633-2648. (2015)
4. Shuo Chen, Xiaoqian Lin, Caigang Zhu and Quan Liu*, "Sequential weighted Wiener estimation for extraction of key tissue parameters in color imaging: a phantom study," Journal of Biomedical Optics, 19(12) 127001 (2014).
3. Shuo Chen, Xiaoqian Lin, Clement Yuen, Saraswathi Padmanabhan, Roger W. Beuerman, Quan Liu*, "Recovery of Raman spectra with low signal-to-noise ratio using Wiener estimation," Optics Express, 22(10), 12102-12114 (2014).
2. S. Chen, Y. H. Ong, and Quan Liu*, "Fast reconstruction of Raman spectra from narrow-band measurements based on Wiener estimation," Journal of Raman Spectroscopy, 44, 875-881 (2013).
1. S. Chen and Quan Liu*, "Modified Wiener estimation of diffuse reflectance spectra from RGB values by the synthesis of new colors for tissue measurements," Journal of Biomedical Optics 17(3), 030501 (2012).
 

2. Development of experimental and numerical methods for depth sensitive optical spectroscopy

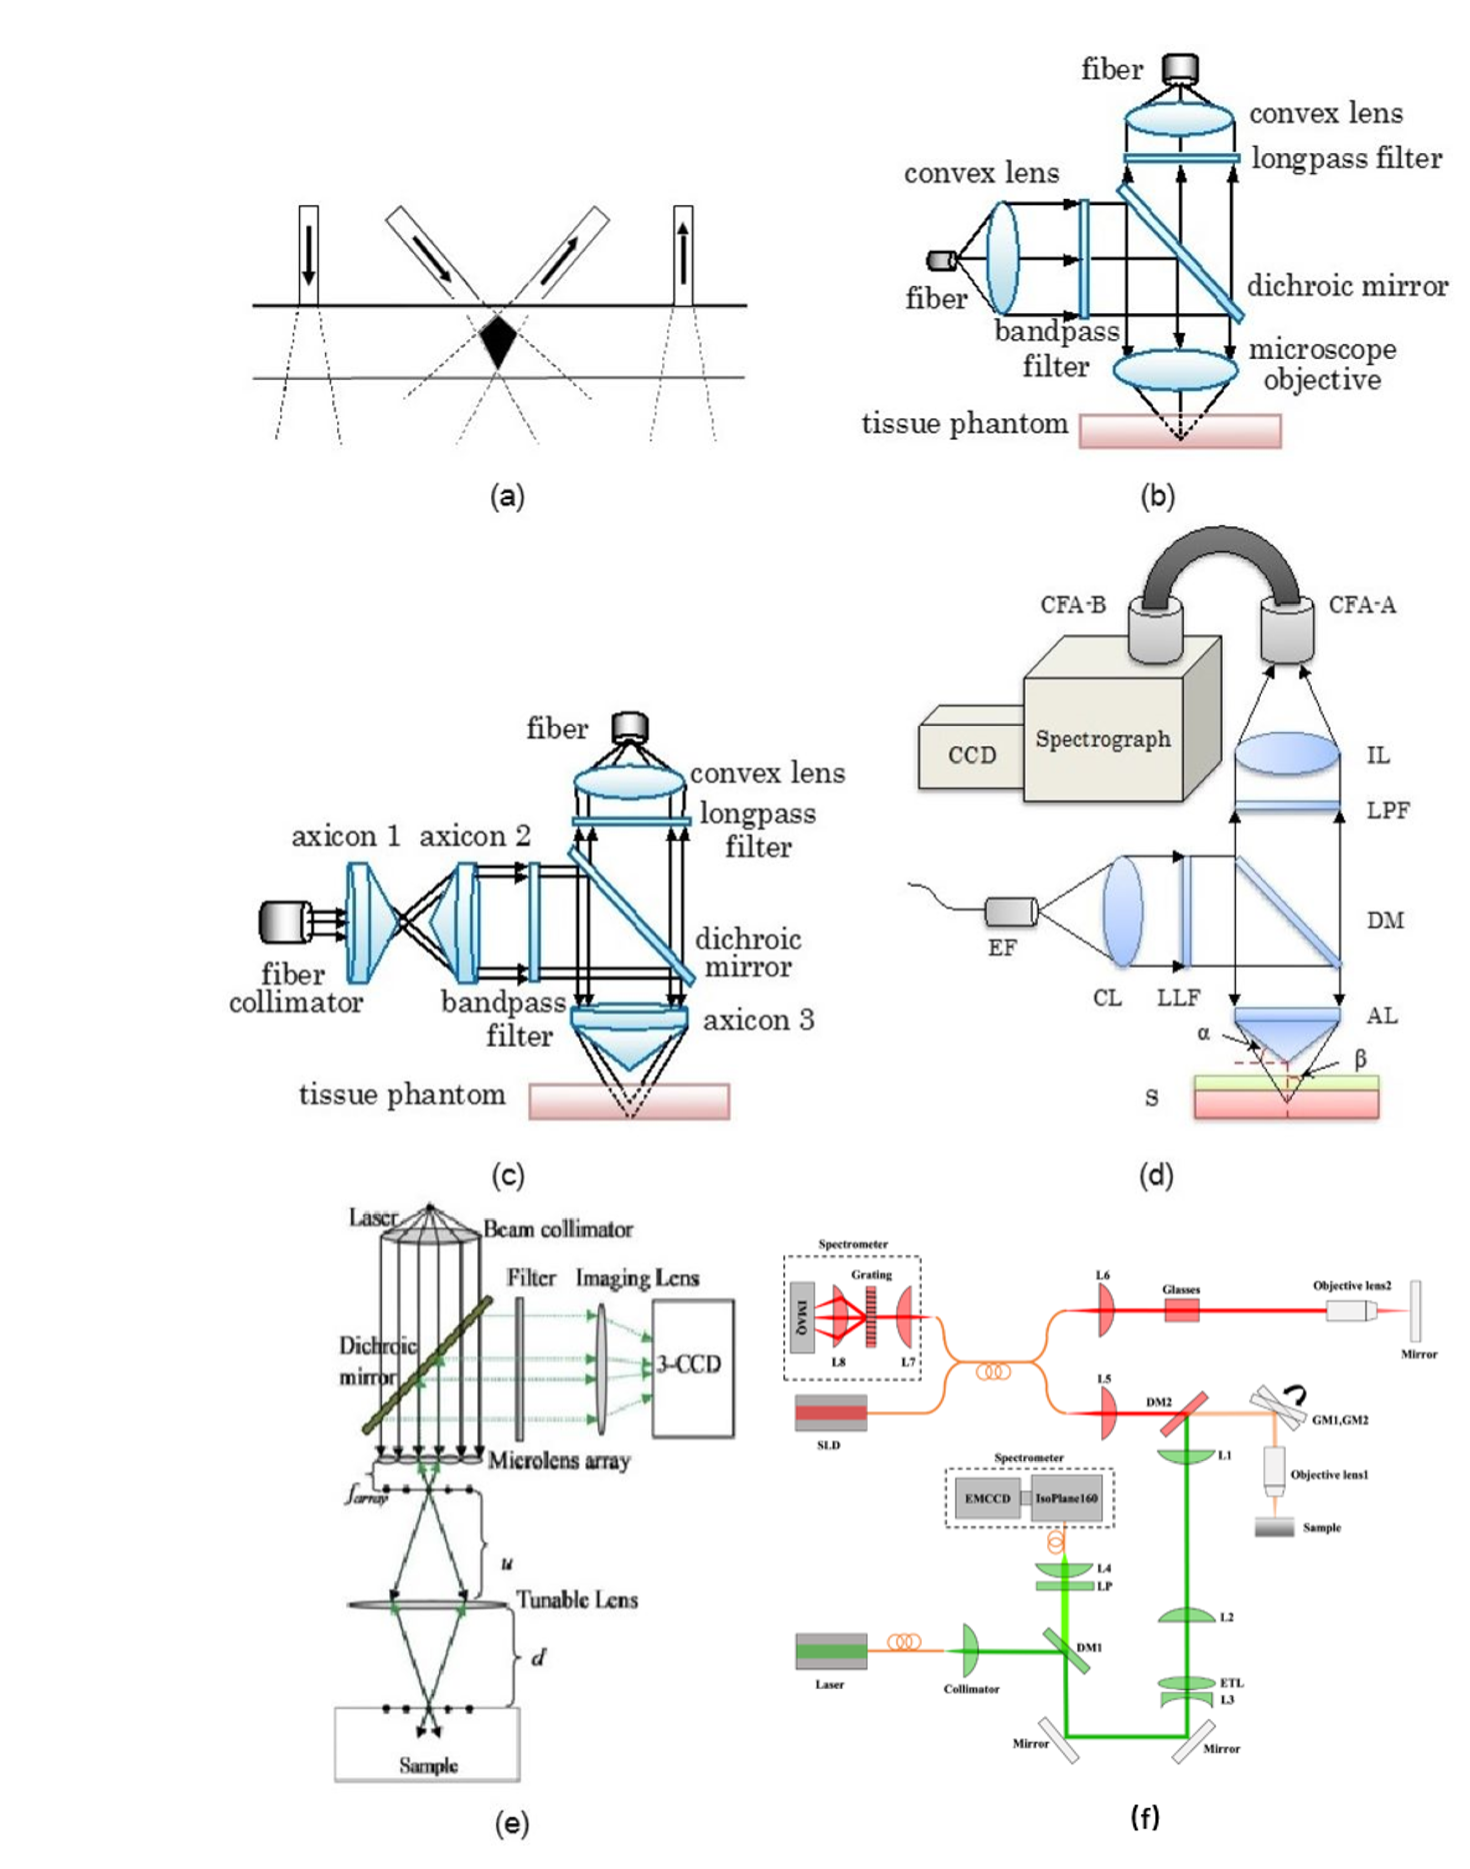
Epithelial tissue is layered but most optical probes average signals from a large tissue volume. This limits the accuracy of optical diagnosis in epithelial cancers and precancers. In response to this challenge, we published one of the first papers in depth selective fluorescence spectroscopy using an angled fiber-optic probe design (Optics Letters 2004) as shown in Fig. 3(a) and a method of sequential estimation to derive the optical properties of a layered tissue (Applied Optics 2006, USA patent nos. 6825928, 7202947 and 7440659). To overcome the limitation of the fiber-optic probe in optical coupling uncertainty, Our group recently proposed depth sensitive optical spectroscopy using an axicon lens based setup (Optics Letters 2013) as shown in Fig. 3(c), which eliminates the need of mechanical movement of either the sample or the imaging lens thus minimizing optical coupling variation as in the traditional objective based setup (Fig. 3(b)). Soon after that, our group accelerated such measurements using a fiber ring assembly (Journal of Biomedical Optics 2013) as shown in Fig. 3(d), which facilitates completely movement-free depth sensitive optical spectroscopy. A patent (US Provisional Patent Application No. 61/873,087 and Patent Application No. 14/475,853) has been filed according to this idea and the prototype device was showcased in TechInnovation 2013 and InnovFest 2014. Our group has further expanded the idea of depth sensitive optical spectroscopy to a spectroscopic imaging setup by developing a multi-focal color imaging technique (Optics Letters 2014) as shown in Fig. 3(e).

In order to analyze the spectroscopy data numerically, we proposed a scaling method to accelerate the traditionally time consuming Monte Carlo (MC) method in a multi-layered homogeneous tissue model by more than two orders of magnitude (Journal of Optical Society of America A 2007). Our group further extended this method to a multi-layered tissue model with finite-size tumors (Journal of Biomedical Optics 2012). Later our group developed a MC method to simulate lens based setups in depth sensitive optical measurements (Optics Express 2012) for the first time.
 
Monte Carlo
 
Fig. 3 Evolution of depth sensitive measurements in our group. (a) Composite fiber-optic probe that contains the inner angled probe for superficial measurements and the outer flat-tip probe for deep measurements (Applied Optics 2006); (b) a common non-contact setup based an objective lens; (c) an axicon lens based cone-shell configuration in which the depth of focus can be tuned without varying the distance between the imaging lens (axicon 3) and the sample (Optics Letters 2013); (d) an improved version of cone-shell configuration in which all depths can be measured simultaneously (Journal of Biomedical Optics 2013); (e) a multi-focal non-contact color imaging for depth sensitive measurements (Optics Letters 2014); (f) a hybrid system (Biomedical Optics Express 2022) in which optical coherence tomography (OCT) is used to guide confocal Raman microspectroscopy for rapid measurements in tissues.
 
The above axicon lens based techniques are limited in depth resolution because axicon lenses can cause serious distortion when used for imaging. Therefore, these techniques are good for diffuse optical measurements but not for high-resolution microscopic measurements. We recently developed a new depth resolved spectroscopy technique to address this issue, which can achieve a depth resolution of a few micrometers. Because its capability of snapshot data acquisition along the entire depth dimension is very similar to A-scan in ultrasound imaging or optical coherence tomography, we call this new technique A-scan optical microscopy, which can be easily adapted for snapshot depth resolved optical spectroscopy.
To overcome the limitation of confocal Raman microspectroscopy in measurement speed, we recently developed a hybrid system (Biomedical Optics Express 2022) as shown in Fig. 3(f), in which another much faster imaging technique, i.e. optical coherence tomography (OCT), is used to guide confocal Raman microspectroscopy for rapid measurements in tissues. An electrically tunable lens is used to quickly vary the focal depth of the Raman module to focus on the target identified from OCT images.

Relevant publications:
18. Xiaojing Ren, Kan Lin, Chao-Mao Hsieh, Linbo Liu, Xin Ge,* and Quan Liu*, "Optical coherence tomography guided confocal Raman spectroscopy for rapid measurements in tissues," Biomedical Optics Express, 13(1), 344-357 (2022).
17. Joshua Weiming Su, Qiang Wang, Yao Tian, Leigh Madden, David Laurence Becker, and Quan Liu*, "Depth-sensitive Raman spectroscopy for skin wound evaluation in rodents," Biomedical Optics Express, 10(12), 6114-6128 (2019).
16. Chao-Mao Hsie, Manish Verma, and Quan Liu*, "Improving depth sensitive fluorescence spectroscopy with wavefront shaping by spectral and spatial filtering," IEEE Access, 7, 170192-170198 (2019).
15. Wei Liu, Yi Hong Ong, Xiaojun Yu, Jian Ju, Clint Michael Perlaki, Linbo Liu and Quan Liu*, "Snapshot depth-sensitive Raman spectroscopy in layered tissues," Optics Express, 24(25), 28312-28325 (2016).
14. Caigang Zhu, Shuo Chen, Christopher Hoe-Kong Chui, Bien-Keem Tan and Quan Liu*, "Early detection and differentiation of venous and arterial occlusion in skin flaps using visible diffuse reflectance spectroscopy and autofluorescence spectroscopy," Biomedical Optics Express, 7(2), 570-580 (2016).
13. Fei Gao, Yi Hong Ong, Gaoming Li, Xiaohua Feng, Quan Liu, and Yuanjin Zheng, "Fast photoacoustic-guided depth-resolved Raman spectroscopy: a feasibility study," Optics Letters, 40(15), 3568-3571. (2015).
12. Yi Hong Ong, Caigang Zhu, and Quan Liu*, "Phantom Validation of Monte Carlo Modeling for Non-contact Depth Sensitive Fluorescence Measurements in an Epithelial Tissue Model," Journal of Biomedical Optics, 19(8), 85006 (2014).
11. C. Zhu, Y. H. Ong and Quan Liu*, "Multifocal noncontact color imaging for depth sensitive fluorescence measurements of epithelial cancer," Optics Letters, 39(11), 3250-3253 (2014).
10. C. Zhu, Shuo Chen, Christopher Hoe-Kong Chui, Bien-Keem Tan and Quan Liu*, "Early Prediction of Skin Viability using Visible Diffuse Reflectance Spectroscopy and Autofluorescence Spectroscopy," Plastic and Reconstructive Surgery, 134(2):240e-7e (2014).
9. Y. H. Ong, and Quan Liu*, "Fast depth-sensitive fluorescence measurements in turbid media using cone shell configuration," Journal of Biomedical Optics 18(11), 110503 (2013).
8. Yi Hong Ong and Quan Liu*, "Axicon lens-based cone shell configuration for depth-sensitive fluorescence measurements in turbid media," Optics Letters, 38(15), 2647-2649 (2013).
7. C. Zhu and Quan Liu*, "Review of Monte Carlo modeling of light transport in tissues," Journal of Biomedical Optics, 18(5), 050902 (2013).
6. C. Zhu and Quan Liu*, "Numerical investigation of lens based setup for depth sensitive diffuse reflectance measurements in an epithelial cancer model," Optics Express 20(28), 29807-29822 (2012).
5. C. Zhu and Quan Liu*, "A hybrid method for fast Monte Carlo simulation of diffuse reflectance from a multi-layered tissue model with tumor-like heterogeneities," Journal of Biomedical Optics 17(1), 010501 (2012).
4. C. Zhu and Quan Liu*, "Validity of the semi-infinite tumor model in diffuse reflectance spectroscopy for epithelial cancer diagnosis: a Monte Carlo study," Optics Express 19(18), 17799-17812 (2011).
3. Quan Liu and N. Ramanujam*, "Scaling method for fast Monte Carlo simulation of diffuse reflectance spectra from multi-layered turbid media," Journal of the Optical Society of America A, 24, 1011-1025 (2007).
2. Quan Liu, and N. Ramanujam*, "Sequential estimation of optical properties of a two-layered epithelial tissue model from depth-resolved ultraviolet-visible diffuse reflectance spectra," Applied Optics, 45, 4776-4790 (2006).
1. Quan Liu, and N. Ramanujam*, "Experimental proof of the feasibility of using an angled fiber-optic probe for depth-sensitive fluorescence spectroscopy of turbid media," Optics Letters 29, 2034-2036 (2004).


3. Surface enhanced Raman spectroscopy (SERS) for malaria diagnosis and minimally invasive microneedles for intradermal measurements

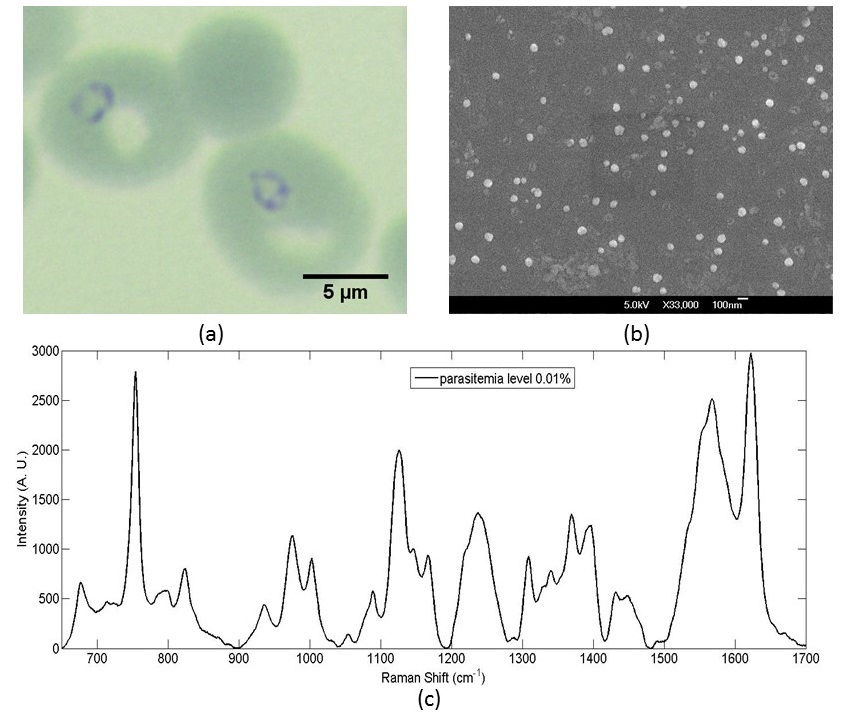
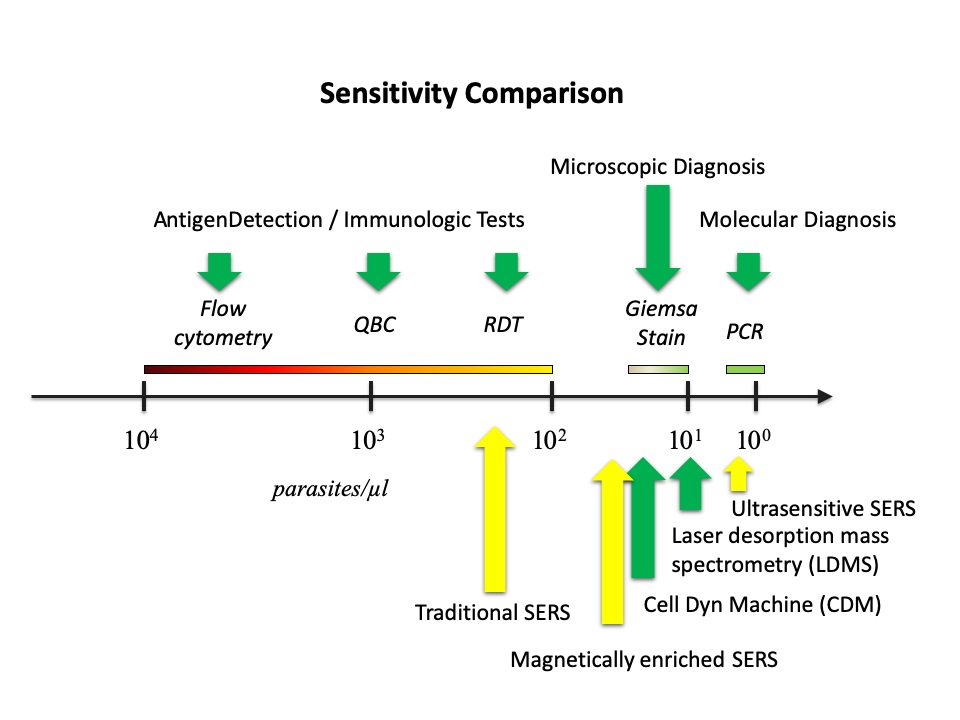
Malaria continues to be one major killer of humans, especially in developing regions. There is lack of effective procedures for early malaria diagnosis in the field. The creative approach developed in our group was the integration of magnetic enrichment with surface enhanced Raman spectroscopy (SERS), which improved the sensitivity of SERS by two orders of magnitude to near that of the standard clinical method (Journal of Biomedical Optics 2012, Analyst 2013 & US Patent Application No. 13/442,594). Our more recent ultrasensitive SERS technique, in which SERS active nanoparticles are synthesized inside parasites to increase the probability of forming hot spots, boosted up the sensitivity of SERS further to outperform the standard method (Scientific Reports 2016), which could lead to a new rapid diagnostic tool suitable for the field use. The sensitivities of other techniques (in green) and SERS techniques including ours (highlighted in yellow) are compared in Fig. 4. We have also shown that the new technique can be used to detect SERS spectra of hemozoin from individual parasites in the ring stage (IEEE JSTQE 2016) as shown in Fig. 5. To make this new technique suitable for deployment in a low-resource setting, we designed a transparency based fluidic chip (Sensors & Actuators: B 2021) as shown in Fig. 6 for on-chip sample preparation and near-analyte nanoparticle synthesis such that a central lab is no longer required for blood sample preparation. This is an important step towards malaria field diagnosis based on surface enhanced Raman scattering. We are currently developing a cost effective Raman spectrometer in an attempt to serve as a low-cost chip reader to prepare for this SERS technique to be adopted widely.
 
SERS
Fig.4 Comparison of the current techniques for malaria diagnosis in terms of sensitivity.
 
 
SERS
Fig. 5 (a) Gimesa stained images of ring-stage parasites; (b) SERS-active metal nanoparticles for SERS measurements in malaria diagnosis; (c) SERS spectrum of hemozoin after sample preparation.
 
SERS
Fig. 6 Schematic drawings and various subassemblies photos of the SERS fluidic chip. (a) Partially exploded schematic and the constituent subassembly components of the chip: (I) reaction module, with 3 sets of dried chemical spots A, B, C, and D; (II) filtration module; (III) inlet for pump; and (IV) detection module. (b) Detailed dimension of (I) reaction module. (c)-(f) Subassembly photos that corresponding to module (I-IV), respectively. (g) Photo of the entire assembled SERS lab-on-chip. (h) Photo of our manual syringe pump. A: Silver Nitrate; B: Sodium Hydroxide C: Hydroxylamine Hydrochloride; D: Sodium Chloride; Al: Aluminum; FG filter: Fiber glass filter paper; G1 filter: Grade 1 filter paper. All holes in this chip are 3 mm in diameter,unless stated as needle hole (0.81mm ),or hole with diameter of 5mm. The needle hole on the Al foil in the detection module does not align to the laser path, while the other needle hole (for laser) on the transparency in the reaction module is intended for passing the laser beam for SERS measurements.
 

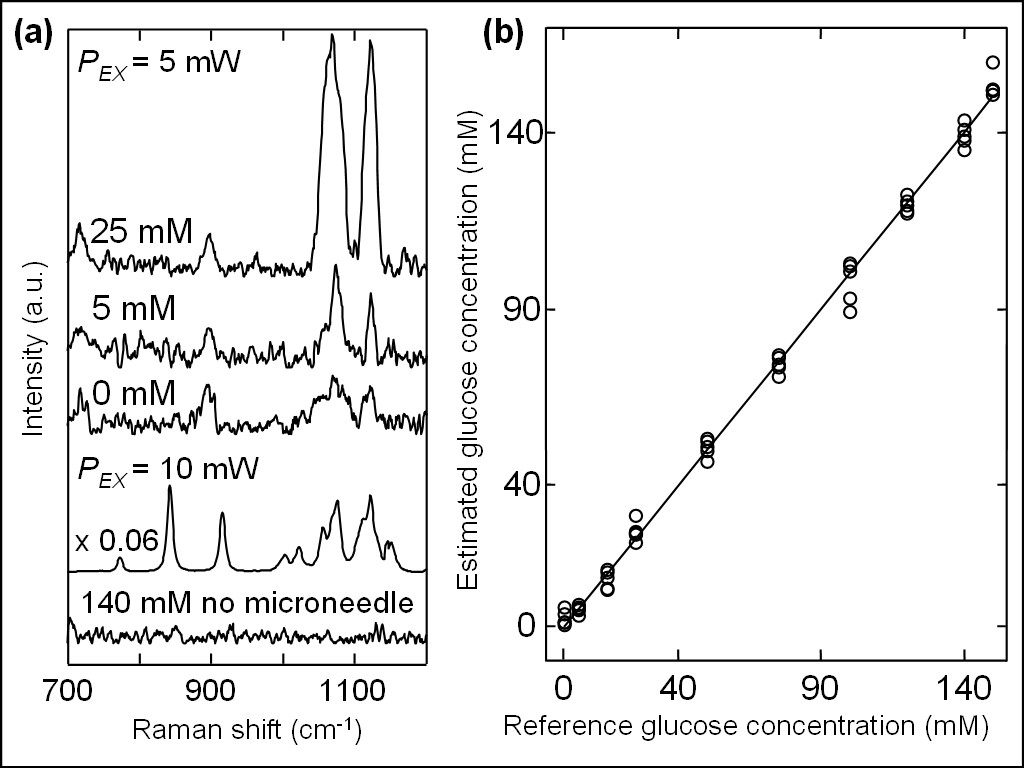
The above method requires blood to be drawn out of patients, which can cause significant inconvenience in sample preparation. Our group developed a stainless-steel microneedle based probe for intradermal measurements (Journal of Biophotonics 2014, selected as the Editor's Choice) as shown in Fig. 7&8, which could eliminate the need of drawing blood out of human body. Our group further developed a deformable agarose microneedle to reduce the risk of sharp injury and cross contamination due to needle reuses (Journal of Biomedical Optics 2015). For applications requiring microneedles with greater strength, we recently demonstrated that a plastic microneedle array can be modified to a surface enhanced Raman spectroscopy based biosensor for minimally invasive in vivo glucose measurements from living mice (ACS Sensors 2020) as shown in Fig. 9.
 
SERS
 
Fig. 7 (a) Image and (b) side view of the setup for the fabrication of 760-μm thick top phantom layers mimicking the skin. (c) Schematic of the Ag film coated microneedle probed into a two-layered phantom for intradermal measurements. (d) Microneedles penetrating through the top layer into the second layer. Note the phantom was placed upside down to facilitate the visualization of penetration. (e) Schematic of the Raman system for SERS measurements.
 
SERS
 
Fig. 8 (a) SERS spectra for the glucose concentrations of 0, 5, and 25 mM positioned inside phantom at 760 μm below the surface measured by using the Ag-coated microneedle-based probe at an excitation power of 5 mW, and ordinary Raman of crystalline glucose and glucose phantom at concentration of 140 mM without microneedle at an excitation power of 10 mW. (b) Correlation between estimated glucose concentrations and reference glucose concentrations, in which the former values were estimated by PLS-LOO method from SERS spectra measured in phantom using the Ag-coated microneedle-based probe.
 
SERS
 
Fig. 9(a) Photograph of the F-PMMA MN array pressed onto the skin on the back of a mouse. (b) Mouse under anesthesia on the stage of the Raman microspectroscopy system for measurements. (c) Schematic illustration of the glucose measurement using the F-PMMA MN array for in vivo transdermal detection based on surface enhanced Raman spectroscopy. (d) Glucose level measured using SERS biosensor for a range of dwelling time from 0 to 15 min. (e) Glucose levels measured using our SERS glucose biosens or (red) in comparison with those obtained from a commercial glucometer (blue). We selected three mice with different blood glucose concentrations for testing in which the excitation power was 16.5 mW out of the needle tip at 785 nm and the exposure time was 10000 ms. Each mouse was tested sequentially for 5 times. (f) A Clarke error grid analysis of the in vivo glucose measurements using our SERS glucose biosensor in a mouse model of STZ- induced type I diabetes.

Relevant publications:
11.Clement Yuen, Xiaohong Gao, Prem Prakash, Yong Jia Ming, Chalapathy Raja Shobana, Perera Adhikarige Taniya Kaushalya, Luo Yue Mei, Bai Yan Ru, Charles Yang Chun, Peter Preiser, and Quan Liu*, "Towards malaria field diagnosis based on surface-enhanced Raman scattering with on-chip sample preparation and near-analyte nanoparticle synthesis," Sensors & Actuators: B. Chemical, 343, 130162 (2021)
10.Jian Ju, Chao-Mao Hsieh, Yao Tian, Jian Kang, Ruining Chia, Hao Chang, Yanru Bai, Chenjie Xu, Xiaomeng Wang, and Quan Liu*, "Surface Enhanced Raman Spectroscopy Based Biosensor with a Microneedle Array for Minimally Invasive In Vivo Glucose Measurements," ACS Sensors, 5(6), 1777-1785 (2020).
9.Jian Ju, Sagar Regmi, Afu Fu, Sierin Lim and Quan Liu*, "Graphene quantum dot based charge-reversal nanomaterial for nucleus-targeted drug delivery and efficiency controllable photodynamic therapy," Journal of Biophotonics, 12(6), e201800367, https://doi.org/10.1002/jbio.201800367 (2019) .
8.Jian Ju, Wei Liu, Clint Michael Perlaki, Keren Chen, Chunhua Feng and Quan Liu*, "Nitrogen doped Graphene Quantum Dots Effectively Preserve Surface Enhanced Raman Performance of Silver Nanoparticles," Under review (2017).
7. Keren Chen, Yi Hong Ong, Clement Yuen, Quan Liu*, "Surface-Enhanced Raman Spectroscopy for Intradermal Measurements", in Imaging in Dermatology, edited by Michael R Hamblin and Pinar Avci, Elsevier (2016) (ISBN: 978-0-12-802838-4), 141-154.
6. Keren Chen, Clint Perlaki, Aoli Xiong, Peter Preiser, and Quan Liu*, "Review of Surface Enhanced Raman Spectroscopy for Malaria Diagnosis and a New Approach for Detection of Single Parasites in the Ring Stage," IEEE Journal of Selected Topics in Quantum Electronics, 22(4), 6900509 (2016)(Invited Paper).
5. Keren Chen, Clement Yuen, Aniweh Yaw, Peter Preiser and Quan Liu*, "Towards ultra-sensitive malaria diagnosis using surface enhanced Raman spectroscopy," Scientific Reports, 6, 20177. (2016).
4. C. Yuen and Quan Liu*, "Hollow agarose microneedle with silver coating for intradermal surface enhanced Raman measurements: A skin-mimicking phantom study," Journal of Biomedical Optics, 20(6), 061102 (2015).
3. C. Yuen and Quan Liu*, "Towards in vivo intradermal surface enhanced Raman scattering (SERS) measurements: silver coated microneedle based SERS probe," Journal of Biophotonics, 7(9), 683-689 (2014) (Editor's Choice).
2. C. Yuen and Quan Liu*, "Optimization of Fe3O4@Ag Nanoshells for malaria diagnosis," Analyst 138(21), 6494-6500 (2013).
1. C. Yuen and Quan Liu*, "Magnetic Field Enriched Surface Enhanced Resonance Raman Spectroscopy for Early Malaria Diagnosis," Journal of Biomedical Optics 17(1), 017005 (2012).


Funding Sources:


MOEMOEMOE